はじめに
GLB事業部Lakehouse部の阿部です。 本記事では、KDB.AIによる頭部MRI画像との類似画像を検索する方法を紹介します。
KDB.AIは、KX systemsが提供するナレッジベースのベクトルデータベースと検索エンジンです。ベクトルデータベースは膨大な量のテキストデータを分析・処理可能であり、テキストデータをベクトル形式に変換することで、コンピューターは入力された自然言語を理解して対応できます。開発者はリアルタイムのデータを使用してAIアプリケーションのための高度な検索、レコメンデーション、パーソナライゼーションを提供することにより、スケーラブルで信頼性の高いリアルタイムアプリケーションを構築できます。
KDB.AIの概要やアカウント作成に関する解説は、前回の記事で解説しています。
本記事では、脳のMRI画像をベクトルとしてKDB.AIに保存し、その画像と類似する画像を探索する方法を紹介します。また、KDBが提供するsample codeを基に作成しております。
- はじめに
- チュートリアルの目的
- 前準備
- 1. Load Image Data
- 2.Create Image Vector Embeddings
- 3. Store Embeddings in KDB.AI
- 4. Query KDB.AI Table
- 5. Search For Similar Images To A Target Image
- 6. Delete the KDB.AI Table
- おわりに
チュートリアルの目的
チュートリアルの目的は、訓練済みのニューラルネットワークを使ってembeddingを作成し、それをベクトルデータベースに保存する手順の紹介です。KDB.AIを用いて入力画像との類似画像を探し出す方法も学びます。具体的に以下の手順で進めます。
- 画像データの読み込み
- embedding画像の作成
- KDB.AIへのembedding画像の保存
- KDB.AIテーブルへのクエリ
- 対象画像の類似画像検索
- KDB.AIテーブルの削除
本記事のコードはGitHubのレポジトリから引用しています。
実行環境はDatabricksのワークスペースですが、お好きなエディターで実行可能です。
前準備
それでは早速コードを見ていきましょう。 まずは必要なパッケージをインストール後、Pythonプロセスを再起動します。
pip install huggingface_hub umap-learn hdbscan tensorflow Pillow matplotlib kdbai_client -q
dbutils.library.restartPython()
必要なライブラリをインポートします。
# download data
import os
from zipfile import ZipFile

# embeddings
from tensorflow.keras.applications.resnet50 import ResNet50, preprocess_input
from tensorflow.keras.preprocessing import image
from PIL import Image
import numpy as np
import pandas as pd
import ast

# timing
# ループやイテラブルな処理の進行状況をプログレスバーとして表示するライブラリ
from tqdm.auto import tqdm

# vector DB
import kdbai_client as kdbai
#パスワードのような機密情報を表示せずに安全に入力するためのユーティリティを提供
from getpass import getpass
import time

# plotting
import hdbscan
import umap.umap_ as umap
from matplotlib import pyplot as plt
'Could not find TensorRT'という警告が出るかもしれませんが、後のコードに影響しないため無視します。
Helper Functionも事前に定義しておきます。
# DataFrameの形状と中身を確認する
def show_df(df: pd.DataFrame) -> pd.DataFrame:
    print(df.shape)
    return df.head()

# 画像を読み込み、表示する
def plot_image(axis, source: str, label=None) -> None:
    axis.imshow(plt.imread(source))
    axis.axis("off")
    title = (f"{label}: " if label else "") + source.split("/")[-1]
    axis.set_title(title)
1. Load Image Data
使用するサンプルデータセットは、Kaggleから取得した脳腫瘍の分類画像です。データセットは、画像中の脳腫瘍に基づいて4つのクラス(神経膠腫、黒色腫、下垂体腫、腫瘍なし)に整理されたMRI脳スキャン画像から構成されています。
オリジナルのKaggleデータセットには、TrainingフォルダーとTestingフォルダーの2つのフォルダーから構成されており、どちらのフォルダーにも腫瘍クラスごとに整理された画像を含んでいます。これらの画像には前処理が施されており、(224, 224, 3)へのリサイズ、各画像のクラス名の変更、そして各画像にディレクトリ内で一意のIDを与えています。
前処理後、データセットのTrainingフォルダーはResNetモデルの学習に使用されており、このモデルはembedding時に使用します。処理後のTestingフォルダーはdataにリネームされ、このノートブックで使用されます。もちろん、ResNetモデルはTestingフォルダーのテストデータを学習していないため、embeddingを作成する際にオーバーフィッティングを避けるのに役立ちます。
Define List Of Paths To The Extracted Image Files
次に、'Testing'ディレクトリ内の異なるサブフォルダーから、画像ファイルのパスを抽出します。これらは、後ほどembeddingを作成する関数に渡すために必要です。
def extact_file_paths_from_folder(parent_dir: str) -> dict:
    image_paths = {}
    for sub_folder in os.listdir(parent_dir):
        sub_dir = os.path.join(parent_dir, sub_folder)
        image_paths[sub_folder] = [
            os.path.join(sub_dir, file) for file in os.listdir(sub_dir)
        ]
    return image_paths
image_paths_map = extact_file_paths_from_folder("data")
画像ファイルのパスを取得できたことがわかります。
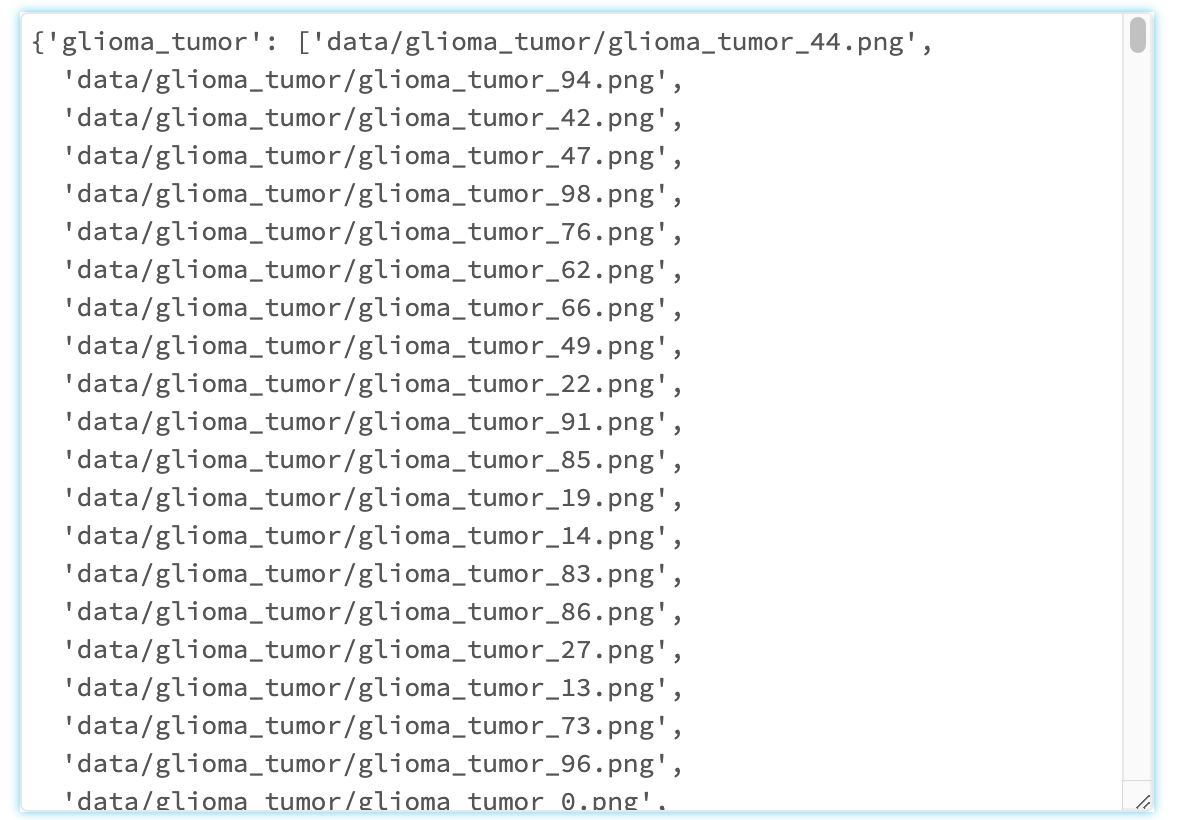
画像ファイルには1~100の番号が振られており、各フォルダーから画像を取得できます。
次に、plot_image()ヘルパー関数を使って、例として20番の画像を表示します。
image_index = 20  # feel free to change this!

# create subplots
_, ax = plt.subplots(nrows=len(image_paths_map) // 2, ncols=2, figsize=(10, 8))
axes = ax.reshape(-1)

# get image at specified index
for i, (_, image_paths) in enumerate(image_paths_map.items()):
    for path in image_paths:
        if path.endswith(f"{image_index}.png"):
            break

    # plot each image in subplots
    plot_image(axes[i], path)
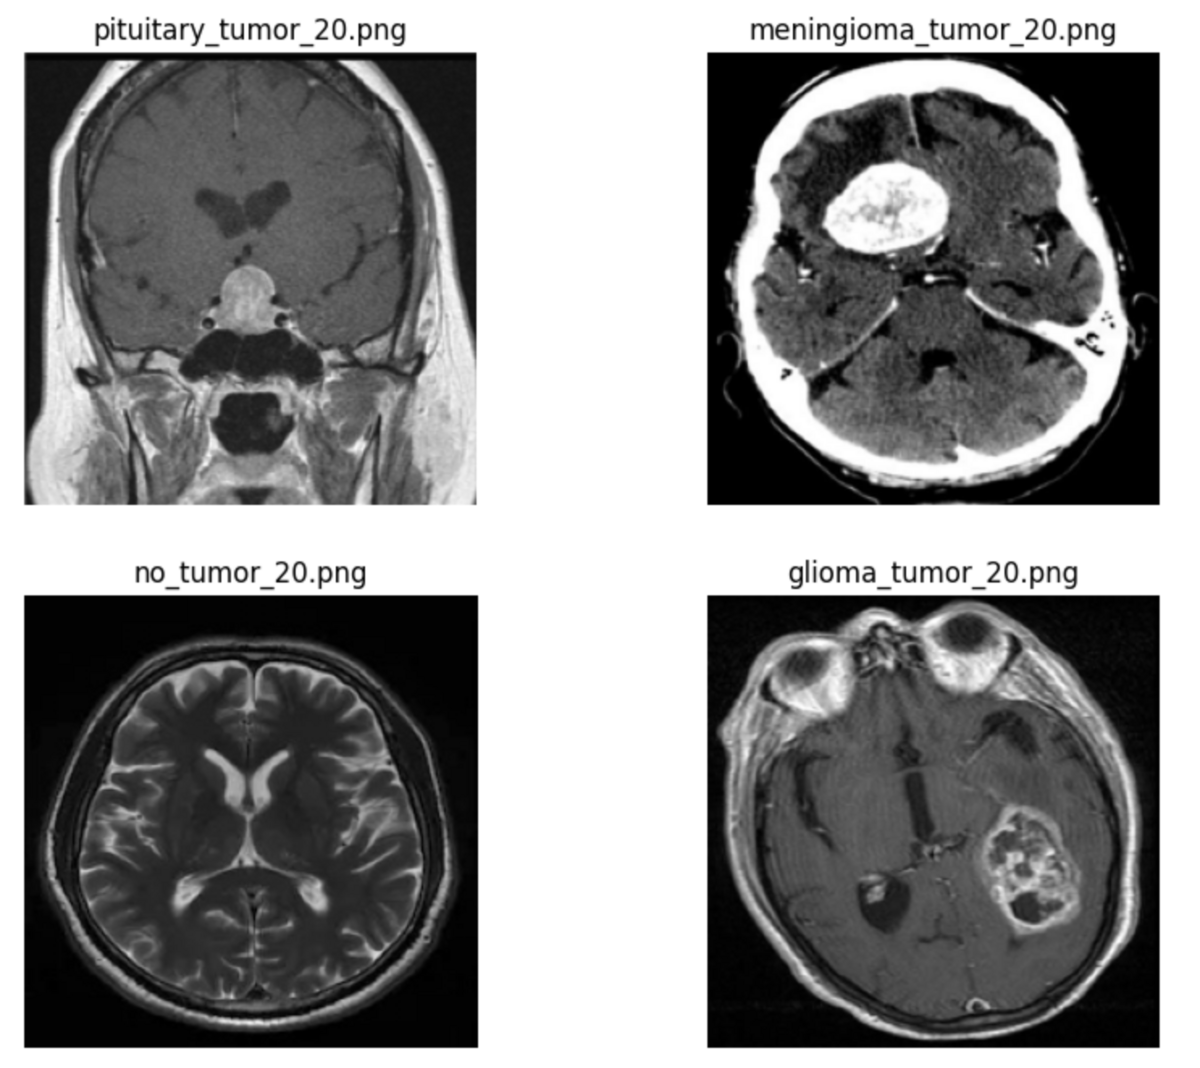
腫瘍のクラスごとに画像を表示できました。
Load data using image_dataset_from_directory()
image_dataset_from_directory()関数は、TensorFlowのKeras APIからインポート済みであり、ディープラーニングのトレーニングや評価の際に、画像データを効率的に扱う関数です。各画像を、その画像のディレクトリに対応するクラスラベルとともに保存するため、embeddingに適した形式でデータとそのラベルを取得できます。
dataset = image_dataset_from_directory(
    "data",
    labels="inferred",# ラベルがディレクトリの名前から推定
    label_mode="categorical",# ラベルをone-hotエンコーディング形式で取得
    shuffle=False,
    seed=1,
    image_size=(224, 224),
    batch_size=1,
)
2.Create Image Vector Embeddings
画像埋め込みを作成するために、脳腫瘍の分類には訓練済みのニューラルネットワークを使用します。この例では、ResNet-50バックボーンを含むネットワークを使用します。ResNet-50は一般的な画像分類タスクによく使われるニューラルネットワークアーキテクチャです。
ResNet-50はもともとImageNetのデータセットを学習しており、データセットにはMRI画像が含まれておりません。異なる脳腫瘍画像の例は含まれていないため、ResNet-50がMRI脳スキャン画像を分類できるように再学習されています。
Load Pre-Trained Classification Neural Network
MRI画像を分類するモデルを読み込みます。Hugging Face HubからKX社のmri_resnet_modelという再学習済みモデルを読み込みます。
model = from_pretrained_keras("KxSystems/mri_resnet_model")
モデルの構造を確認します。
model.summary()
_________________________________________________________________
 Layer (type)                Output Shape              Param #
=================================================================
 resnet50 (Functional)       (None, 2048)              23587712

 flatten_1 (Flatten)         (None, 2048)              0

 dense_2 (Dense)             (None, 8)                 16392

 dense_3 (Dense)             (None, 4)                 36

=================================================================
Total params: 23604140 (90.04 MB)
Trainable params: 23551020 (89.84 MB)
Non-trainable params: 53120 (207.50 KB)
_________________________________________________________________
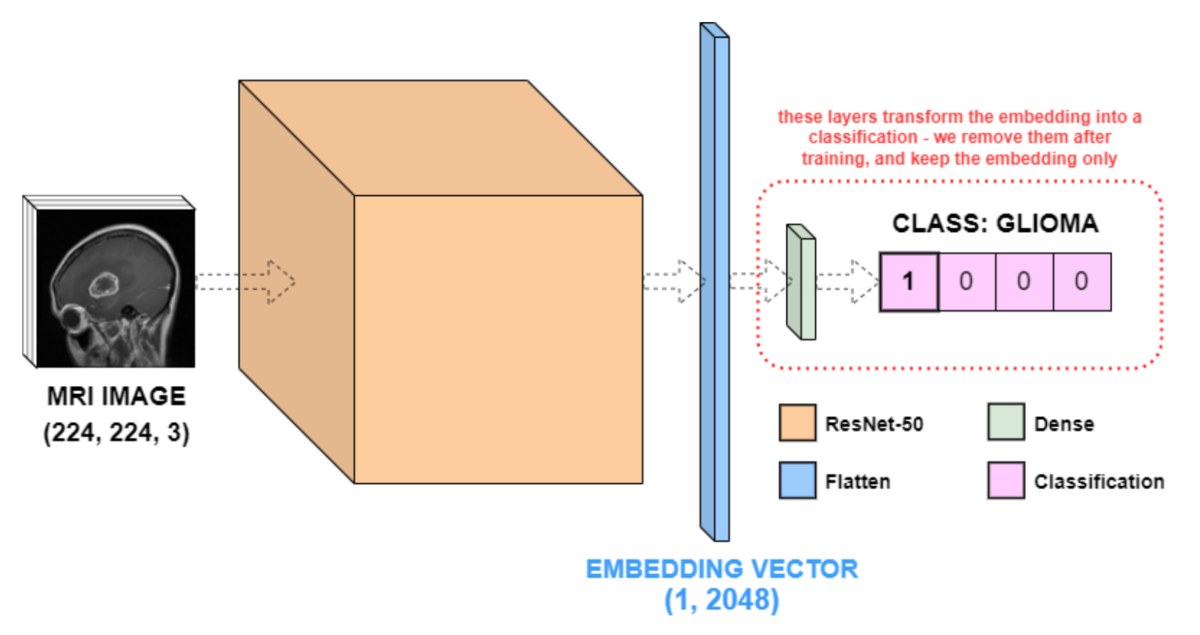
このモデルには4つのレイヤー(ResNet-50、Flatten、そして2つのDense)から構成されており、ResNet-50のレイヤーは、実際には多くのレイヤーを1つの名前で抽象化したものであるため、何百万ものパラメーターが含まれています。Flatten層は、ResNet-50の出力を(1, 2048)のベクトル(特徴ベクトル)に平坦化し、最後の2つのDense層(もしくは全結合層)は、ResNet-50の特徴量ベクトルを入力画像のクラスに合わせて4列のデータに変換します。
model.summary()の結果を詳しく説明した以下のネットワークの図を示します。
(https://github.com/KxSystems/kdbai-samples/blob/main/image_search/image_search.ipynbから引用)
Transform Classification Network Into Embedding Network
4つの脳腫瘍クラスを分類するためにDense層が必要でしたが、実はもう必要ありません。この例では、Dense層の出力値ではなく、embedding後の値に興味があります。したがって、pop()を呼び出して上記モデルにおける2つのDense層を削除します。モデルの新しい出力は、(1, 2048)の特徴量ベクトル、つまり入力画像のResNet-50のembedding vectorです。
model.pop()
model.pop()
model.summary()
_________________________________________________________________
 Layer (type)                Output Shape              Param #
=================================================================
 resnet50 (Functional)       (None, 2048)              23587712

 flatten_1 (Flatten)         (None, 2048)              0

=================================================================
Total params: 23587712 (89.98 MB)
Trainable params: 23534592 (89.78 MB)
Non-trainable params: 53120 (207.50 KB)
_________________________________________________________________
Dense層を削除できました。
Use Embedding Network To Create Image Embeddings
embeddingデータを取得するために、各画像に対してモデルを使用して特徴量を抽出し、その特徴量とクラスラベルをそれぞれのNumpy配列に保存する処理を行います。
# create empty arrays to store the embeddings and labels
num_files = len(dataset)
embeddings = np.empty([num_files, 1, 2048])
labels = np.empty([num_files, 1, 4])

# for each image in dataset, get its embedding and class label
for i, image in tqdm(enumerate(dataset)):
    embeddings[i, :, :] = model.predict(image[0], verbose=0)
    labels[i, :, :] = image[1]
これでクラスラベルが得られたため、ベクトル内のどのインデックスが1に等しいかをチェックすることで腫瘍のタイプを取得できます。
# reduce these vectors from 3 dimensions to 2 dimensions
reduced_embeddings = embeddings[:, 0, :]
reduced_labels = labels[:, 0, :]

# list the tumor types in order
tumor_types = ["glioma", "meningioma", "no_tumor", "pituitary"]

# for each vector, save the tumor type given by the high index
class_labels = [tumor_types[label.argmax()] for label in reduced_labels]
画像の名前だけでなく、ファイルパス全体を保存しておくと便利なことが多いため、下のセルでは、ファイルを繰り返し処理してファイルパスを保存しています。
# get a single list of all paths
all_paths = []
for _, image_paths in image_paths_map.items():
    all_paths += image_paths

# sort the source_files in alphanumeric order
sorted_all_paths = sorted(all_paths)
これで、画像ファイルパス、画像クラス、ベクトル埋め込みというすべてのコンポーネントが揃いました。次のステップでは、KDB.AIのベクトルデータベースに挿入するために、すべてをDataFrameに変換します。
embedded_df = pd.DataFrame(
    {
        "source": sorted_all_paths,
        "class": class_labels,
        "embedding": reduced_embeddings.tolist(),
    }
)

show_df(embedded_df)

画像ファイルパス、腫瘍のclass、 embeddingの値からなるDataFrameを作成できました。
Visualising The Embeddings
特徴量のembeddingは高次元であることから、どのように整理してクラスタリングできるか理解することは難しいです。特徴量整理をわかりやすく認識する方法としてUMAPがあります。UMAPは次元削減の方法であり、クラスタリングを2Dで可視化するテクニックです。これによって、分類ネットワークの成功がよりよくわかるだけでなく、誤分類がどこで起こりうるかについての洞察も得られます。
_umap = umap.UMAP(n_neighbors=15, min_dist=0.0) # UMAP's instance
umap_df = pd.DataFrame(_umap.fit_transform(reduced_embeddings), columns=["u0", "u1"]) # 次元削減
UMAPインスタンス作成時のパラメーターを示します。
- n_neighbors: UMAPが各データポイントの近傍をどれだけ考慮するかを指定します。値が大きいと、大局的なデータ構造が強調され、小さいと、局所的なデータ構造が強調されます。
- min_dist: 低次元空間でのデータポイント間の最小の距離を指定します。この距離が小さいと、データポイントがクラスターを形成しやすくなり、大きいと、データポイントが広がりやすくなります。
次元削減前
reduced_embeddings
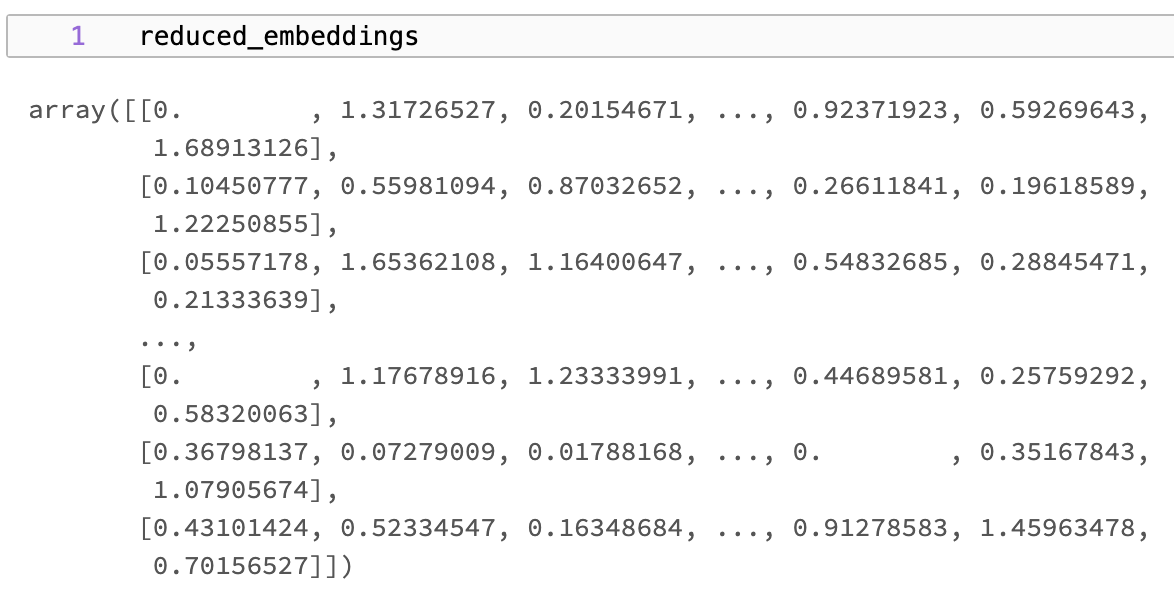
次元削減後
show_df(umap_df)
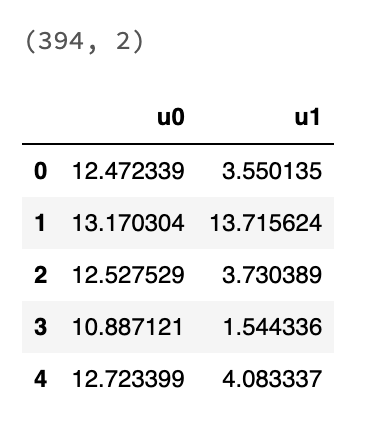
UMAPを用いて2次元のDataFrameに次元削減できました。
次に、次元削減したembeddingデータをクラスタリングします。クラスタリングにはHDBSCAN(Hierarchical Density-Based Spatial Clustering of Applications with Noise)を用いています。
_hdbscan = hdbscan.HDBSCAN(min_cluster_size=5)
clusters = _hdbscan.fit_predict(umap_df)

# number of unique clusters
len(list(set(clusters)))
22
22個のクラスターを形成しました。 min_cluster_sizeは、クラスターとして認識される最小の点の数を指定します。この例では、5つ未満の点を持つクラスターはノイズとして扱われます。
ここで、各クラスを異なる色で表示して、embeddingを2Dでプロットします。
# define color for each class label
class_colors = {
    'glioma': 'blue',
    'meningioma': 'red',
    'no_tumor': 'green',
    'pituitary': 'purple',
}

# Create a figure for plotting
plt.figure(figsize=(10, 8))

# Scatter plot with 'u0' and 'u1' columns as x and y, color mapped by class_labels
for class_label, color in class_colors.items():
    indices = [i for i, label in enumerate(class_labels) if label == class_label]
    subset = umap_df.iloc[indices]
    plt.scatter(subset['u0'], subset['u1'], label=f'{class_label}', color=color)

# beutify plot
plt.title('Embeddings Map for MRI Brain Scan Images')
plt.xlabel('u0')
plt.ylabel('u1')
plt.legend()
plt.show()
腫瘍クラスごとのembeddingをプロットした結果です。
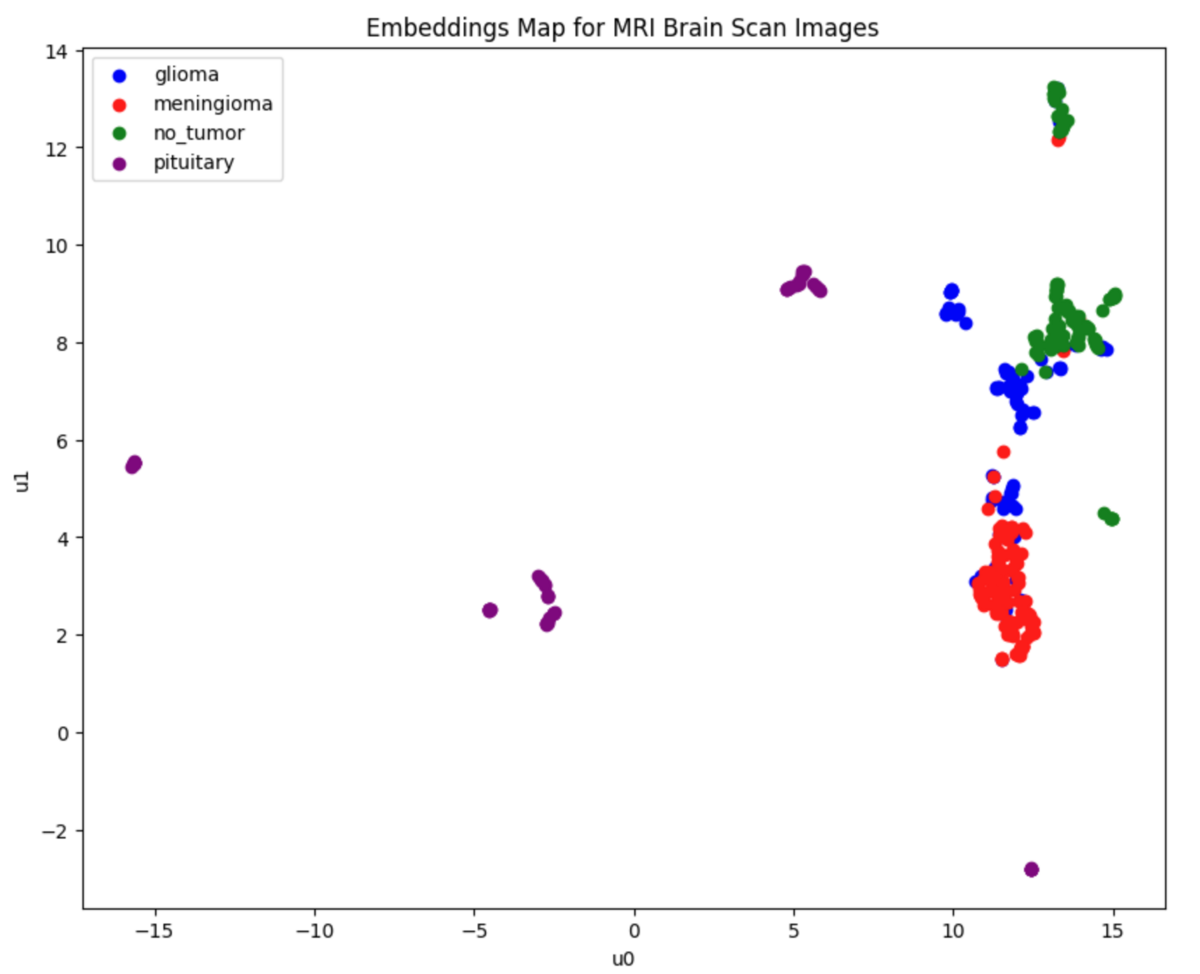
上に示すように、データのほとんどをクラス間で分離できているが、とくに神経膠腫クラス(青色で表示)ではまだ重複がある。しかし、グラフ上の点の大部分は、その「最近接点」が自分と同じクラスに属している。したがって、embeddingデータを使ってベクトルの類似性検索を行う場合、結果の大部分は同じクラスのものであるはずです。
3. Store Embeddings in KDB.AI
KDB.AIセッションに接続します。 KDB.AIを使用するには、URLエンドポイントとAPIキーの2つのセッション情報が必要です。 こちらから無料でサインアップできます。
kdbai.SessionからKDB.AIセッションに接続し、KDB.AIクラウドポータルからセッションURLエンドポイントとAPIキーの詳細を渡します。
KDBAI_ENDPOINT = (
    os.environ["KDBAI_ENDPOINT"]
    if "KDBAI_ENDPOINT" in os.environ
    else input("KDB.AI endpoint: ")
)
KDBAI_API_KEY = (
    os.environ["KDBAI_API_KEY"]
    if "KDBAI_API_KEY" in os.environ
    else getpass("KDB.AI API key: ")
)
sessionを作成します。
session = kdbai.Session(api_key=KDBAI_API_KEY, endpoint=KDBAI_ENDPOINT)
Define Vector DB Table Schema
埋め込みデータを格納するKDB.AIテーブルのスキーマを定義します。このテーブルには、embeddingしたデータフレームと同じ3つのカラムが含まれます:
source: 生画像ファイルへのファイルパス
class: 腫瘍クラスラベル
embedding:類似性検索用の2048次元特徴ベクトル
image_schema = {
    "columns": [
        {"name": "source", "pytype": "str"},
        {"name": "class", "pytype": "str"},
        {
            "name": "embedding",
            "vectorIndex": {"dims": 2048, "metric": "L2", "type": "hnsw"},
        },
    ]
}
Crate Vector DB Table
次に、KDB.AIのcreate_table()関数を使用して、ベクター・データベースに定義されたスキーマに一致するテーブルを作成します。
# ensure the table does not already exist
try:
    session.table("mri").drop()
    time.sleep(5)
except kdbai.KDBAIException:
    pass

table = session.create_table("mri", image_schema)
Add Embedded Data to KDB.AI Table
KDB.AIに挿入する前に、データのメモリ使用量をチェックします。データサイズは10MB以下が推奨されているためです。
# convert bytes to MB
embedded_df.memory_usage(deep=True).sum() / (1024**2)
10MBよりも大きい場合はバッチ(チャンク)分割を考えますが、このデータセットは6MBしかないため、一度にすべてのデータを挿入できます。
table.insert(embedded_df)
Verify Data Has Been Inserted
table.query()を実行すると、データが追加されたことがわかります。
table.query()
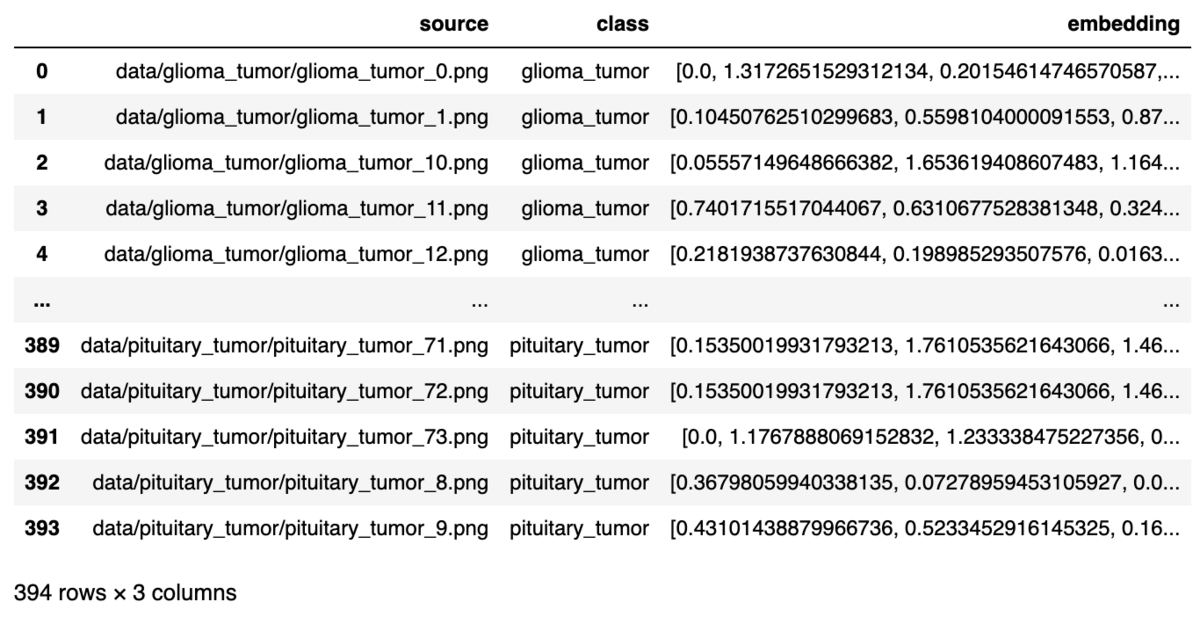
4. Query KDB.AI Table
すべての画像の埋め込みがKDB.AIのデータベースに登録されたため、いよいよKDB.AIの高速クエリ機能を実証します。
クエリー関数は、フィルタリング、集計、ソートが簡単にできるように、さまざまな引数を受け付けます。table.query()を実行すると、これらすべてを確認できます。
ファイル名に "glioma"を含む画像をフィルタリングして、これを実演してみます。
table.query(filter=[("like", "class", "*glioma*")])
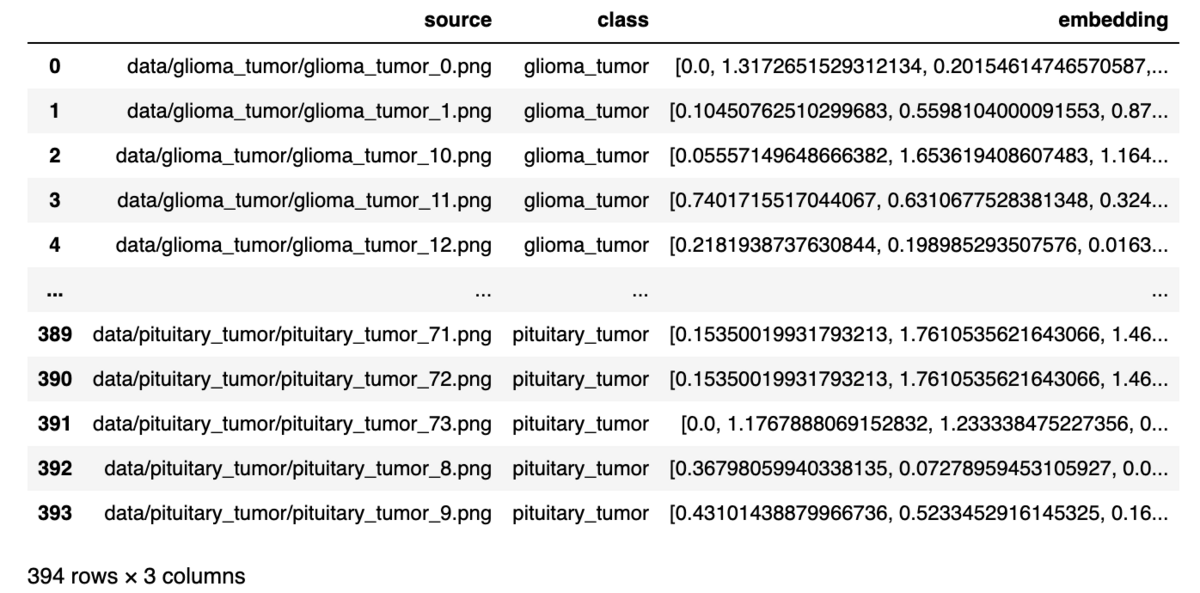
腫瘍クラスが"glioma"であるデータソースとembeddingデータを取得できました。
5. Search For Similar Images To A Target Image
最後に、画像の類似性検索を行います。これはtable.search()関数を使って行います。
Choose Example Image
まずは、テストデータセットからランダムに行を選びます。
# Get a sample row
random_row_index_1 = 40

# Select the random row and the desired column's value
random_row_1 = embedded_df.iloc[random_row_index_1]

plot_image(plt.subplots()[-1], random_row_1["source"], label="Query Image")
こちらの画像との類似画像を検索します。
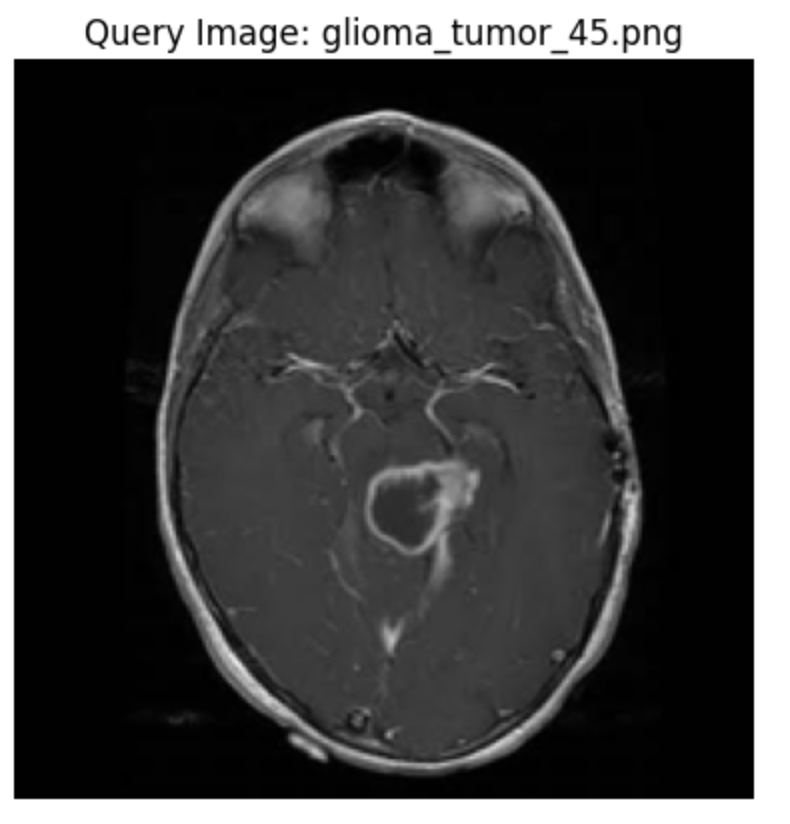
この画像のembeddingをsample embedding変数に保存します。
sample_embedding_1 = random_row_1["embedding"]
Search Based On The Chosen Image
sample_embeddingで抽出したembeddingデータを使って、クエリ画像にもっとも近い8つの近傍画像を探します。
results_1 = table.search([sample_embedding_1], n=8)
results_1[0]

table.search()から返される結果は、最近傍距離__nn_distanceの値とともに、もっとも近いマッチを表示します。先ほど選んだサンプル画像との__nn_distanceは、もちろん0となります。
Plot Most Similar Images
これらの画像を可視化してみましょう。plot_test_result_with_8NN()関数は、クエリ画像とその8つの最近傍画像をプロットします。
def plot_test_result_with_8NN(test_file: str, neighbors: pd.Series) -> None:
    # create figure
    _, ax = plt.subplots(nrows=3, ncols=3, figsize=(12, 7))
    axes = ax.reshape(-1)

    # plot query image
    plot_image(axes[0], test_file, "Test")

    # plot nearest neighbors
    for i, (_, value) in enumerate(neighbors.items(), start=1):
        plot_image(axes[i], value, f"{i}-NN")

nn1_filenames = results_1[0]["source"]
plot_test_result_with_8NN(random_row_1["source"], nn1_filenames)
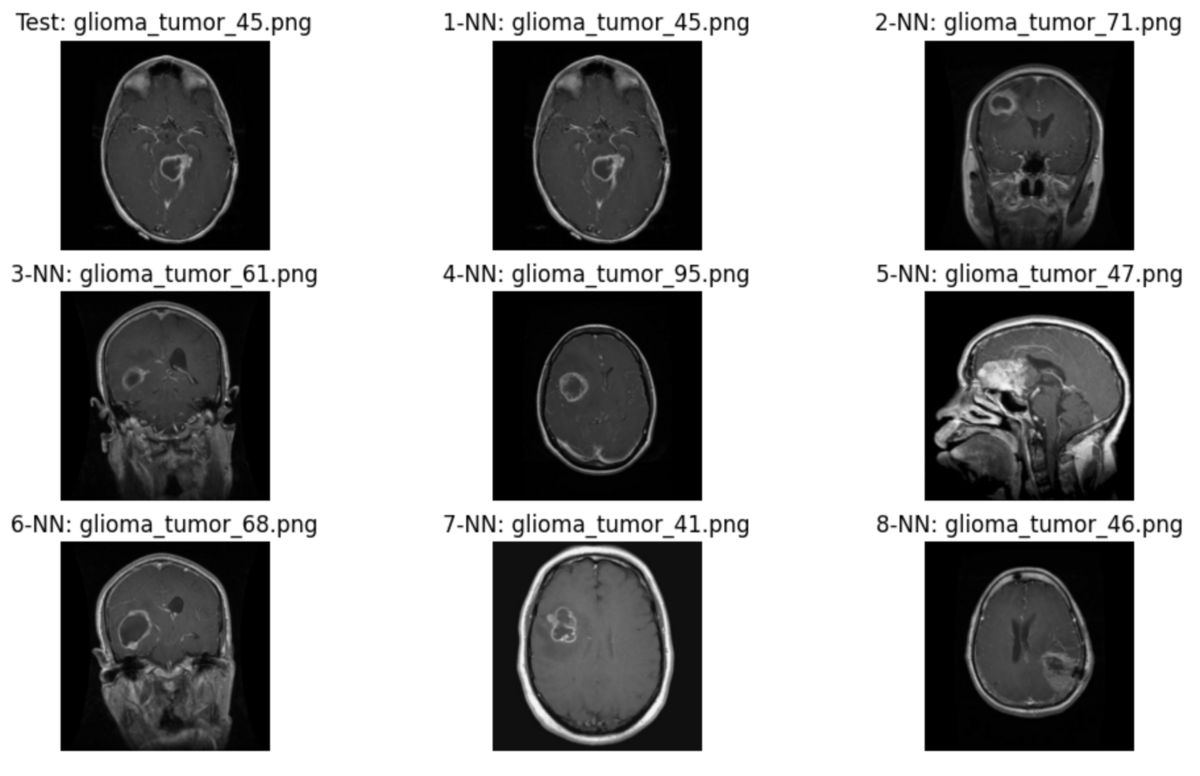
返された画像の中には異なる断面の画像も含まれますが、腫瘍のコントラストがテスト画像と類似していると思います。
Automate This Search Process
以上の手順を踏まえて、サンプル画像の選択から8つの画像を表示するまでをmri_image_nn_search関数として定義します。
def mri_image_nn_search(table, df: pd.DataFrame, row_index: int) -> None:
    # Select the random row and the desired column's value
    row = df.iloc[row_index]

    # get the embedding from this row
    row_embedding = row["embedding"]

    # search for 8 nearest neighbors
    nn_results = table.search([row_embedding], n=8)

    # plot the neighbors
    plot_test_result_with_8NN(row["source"], nn_results[0]["source"])
別のサンプル画像との類似画像を検索します。
# Get another row
random_row_index_2 = 210

mri_image_nn_search(table, embedded_df, random_row_index_2)
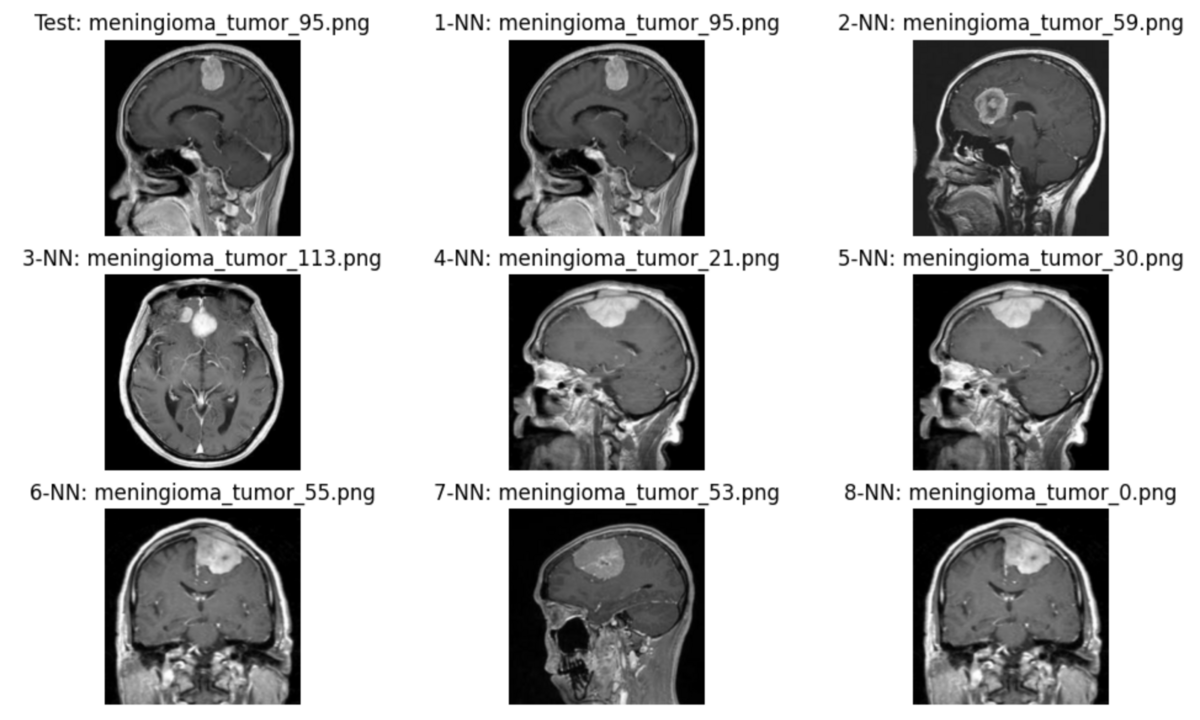
返された類似画像とテスト画像との断面像が異なりますが、腫瘍のコントラストが類似していると思います。 この結果は、腫瘍かどうか判断する医師の診断材料になると思います。
6. Delete the KDB.AI Table
以上でデータセットの準備からテスト画像との類似画像の検索まで行いました。 テーブルを使い終わったら、そのテーブルを捨てるのがベストプラクティスです。
table.drop()
おわりに
今回の記事では、KDB.AIを使ったMRI画像の類似検索を行いました。今回はMRI画像を対象としましたが、KDB.AIは高速なクエリ機能を持っているため、製造ラインで行われるリアルタイムの不良品検出等にも転用できると思います。

Lakehouse部ではデータ&AI案件での開発及びコンサルティングを行うエンジニア/PMを募集しています。 また、他部署でも募集しておりますので、APCにご興味がある方はカジュアル面談か求人一覧からご応募をお待ちしております。
