
Introduction
This is May from the Lakehouse Department of the GLB Division.
KX Systems leveraged the time series database kdb+ to release KDB.AI in September 2023. KDB.AI is a powerful knowledge-based vector database and search engine that uses real-time data to provide advanced search, recommendations, and personalization for AI applications.
In this article, we will introduce pattern matching of sensor data in the KDB.AI sample code introduced in the previous article.
Contents
Introduction to pattern matching of sensor data
This sample code demonstrates the process of using KDB.AI's similarity search to perform pattern matching on time series data. The goal is to obtain historical time series data that matches a specific pattern.
Pattern matching is useful in a wide range of manufacturing scenarios, including quality control, process optimization, and predictive maintenance. For example, we have time-series data that represents performance and can be used to detect abnormal machine movements (up, down, recurring trends, etc.). Uses KDB.AI's vector database to find historical patterns that match the input query pattern. The process flow is as follows.
- Read sensor data and preprocess
- Create a vector embedding
- Save embeds in KDB.AI
- Search for sequences similar to the target sensor sequence
- Delete KDB.AI table
Sample data is used from Kaggle. Data from 52 sensors from the water pump (220,320 lines) is stored in the sensor.csv file. www.kaggle.com
Sample code practice
Let's try uploading the sample code and data on Databricks Workspace.
kdb.ai
1. Read sensor data and preprocess
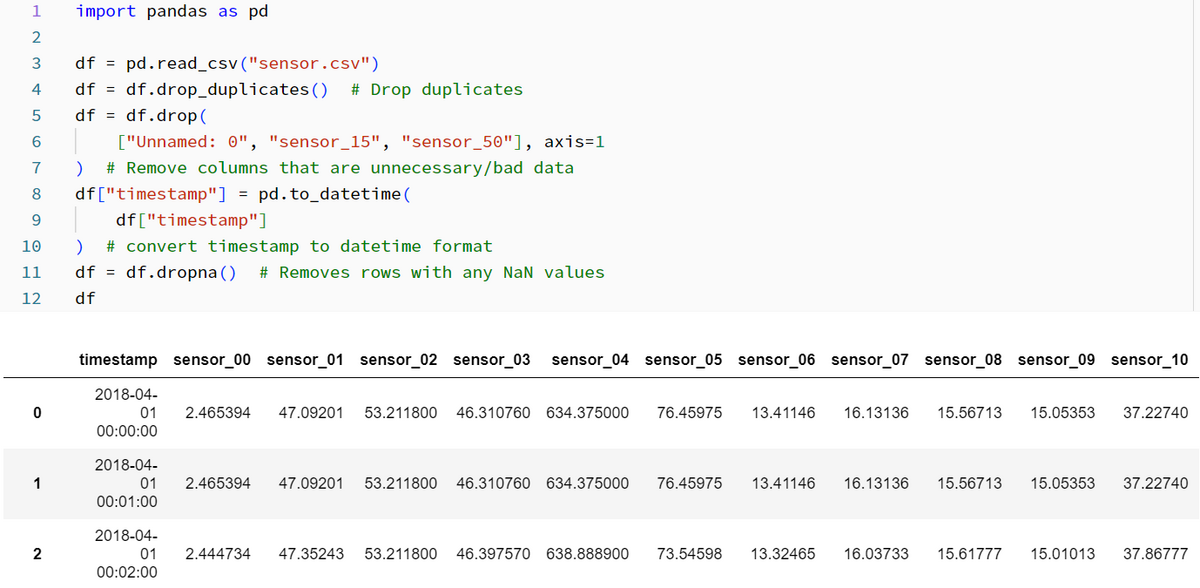
After extracting the data from the zip file, read the csv file. The following process is performed for the entire process.
- Remove duplicates
- Delete columns of unnecessary data
- Delete rows where all columns have null values
- Convert timestamp to datetime format
2. Create a vector embedding
Create the embedding using a combination of windowing and data normalization. Get a single sensor value and group it into a window.
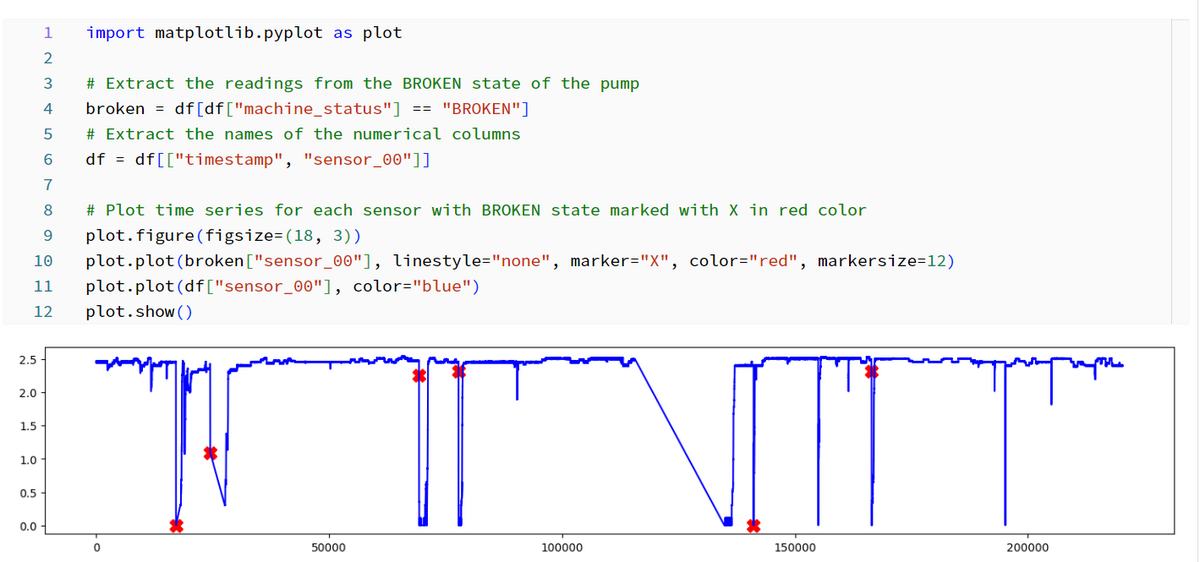
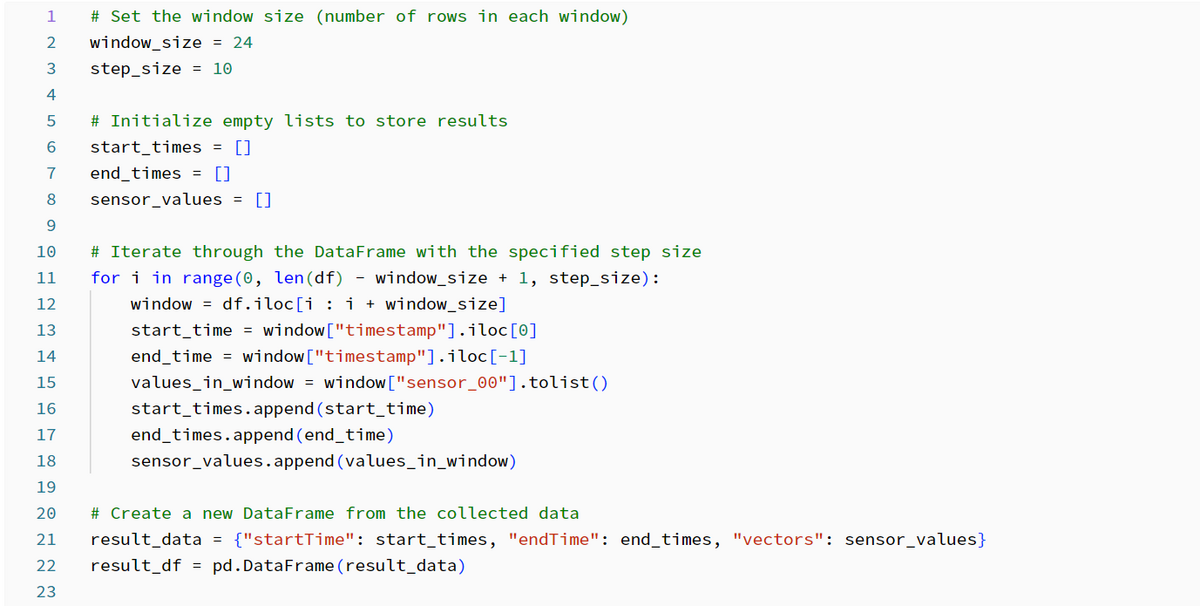
Each window contains a specified number of rows and a step size that determines how the rows are shifted along the timeline.
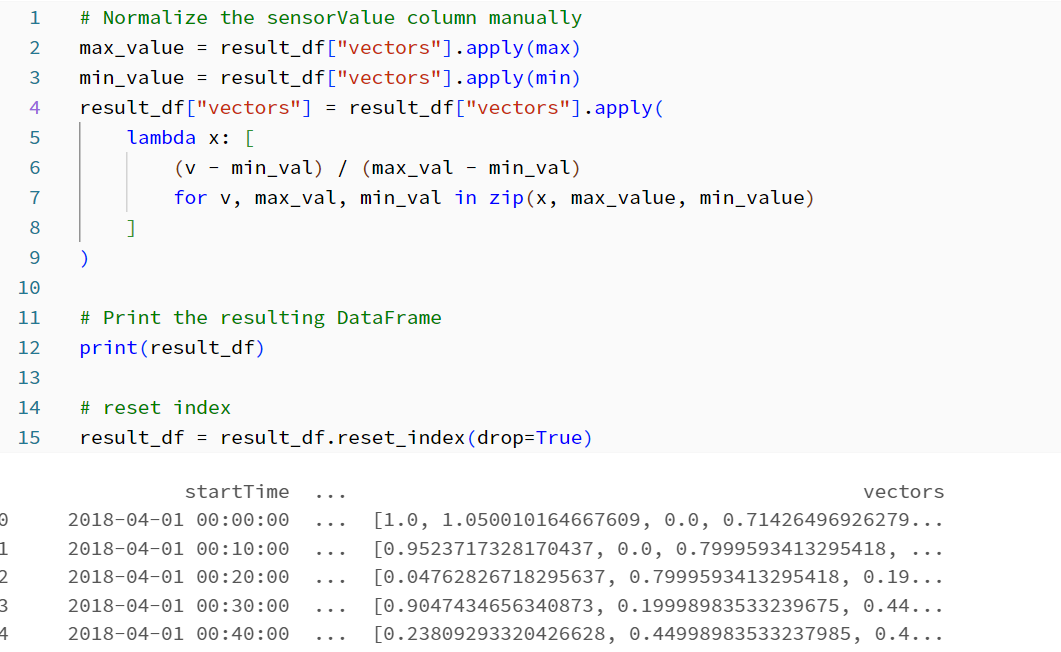
Next, perform manual normalization of the sensor values within each window.
3. Save embeds in KDB.AI
Connect KDB.AI session with API key and Endpoint. Please refer to the article below for how to create an API key. techblog.ap-com.co.jp
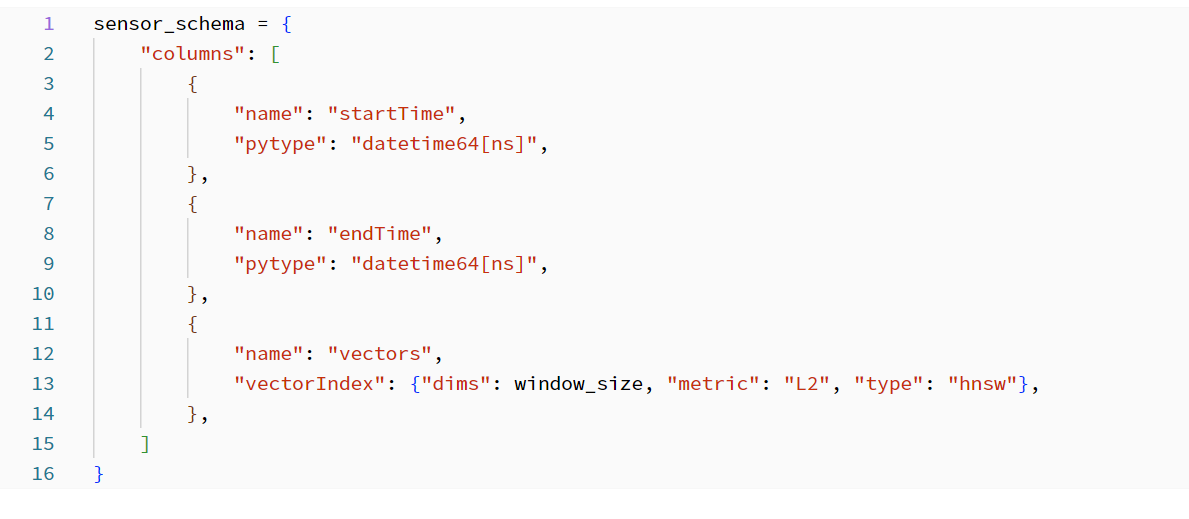
After connecting to KDB.AI, create a schema. To save time series data as a vector, set the "startTime, endTime, vectors" columns. To create an index, as a parameter
- Previously set window size
- Distance metric
- Index type is required.
Distance metrics are used to measure the similarity between vectors. KDB.AI supports Euclidean distance L2, Dot product IP, and Cosine similarity CS. In this sample code, L2 is selected.
In KDB.AI, Flat, IVF, IVFPQ, and HNSW can be used as indexes. In this sample code, HNSW is selected.
Create a table with the configured schema and save the embedded data in the table.
4. Search for sequences similar to the target sensor sequence
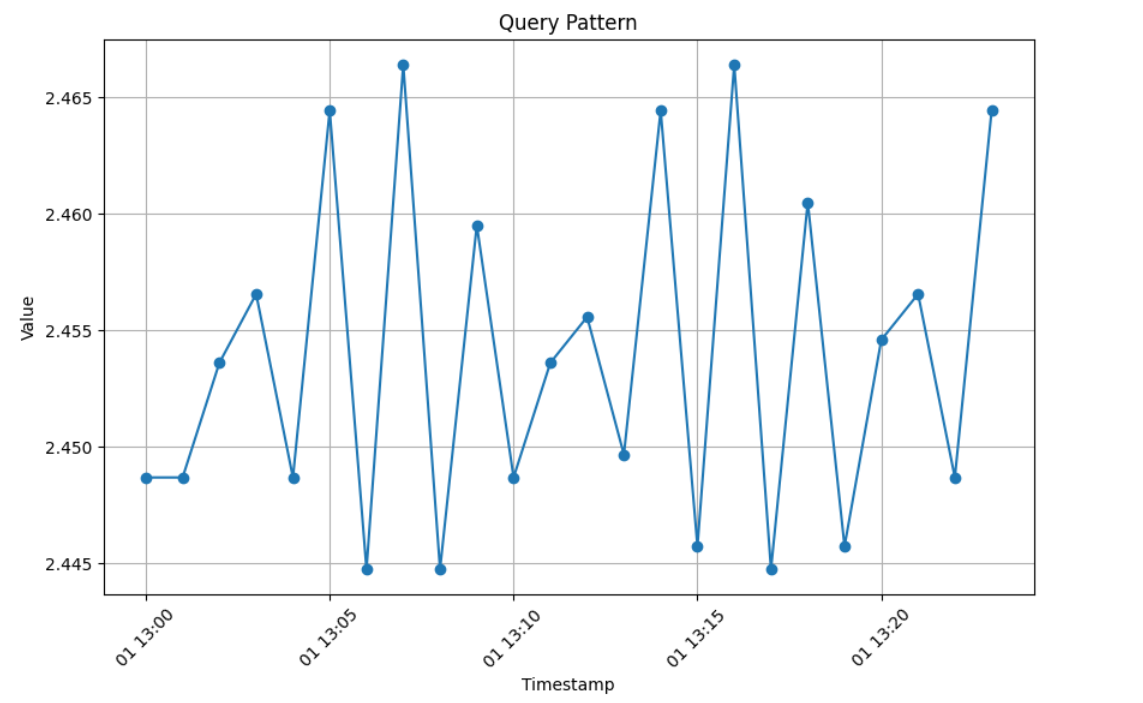
Select and visualize the vector value from the start time "2018-04-01 13:00:00" of sensor_00.
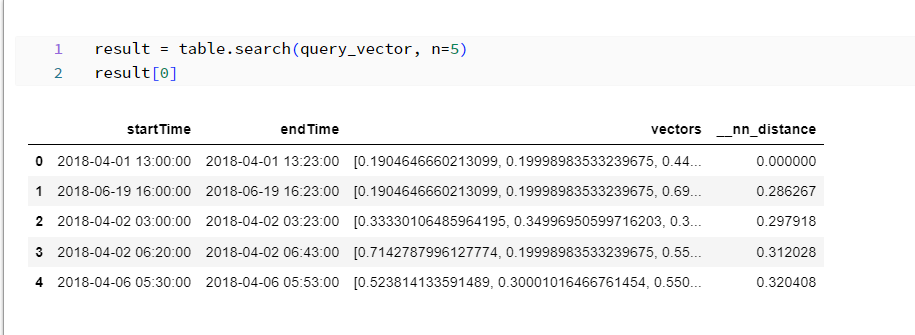
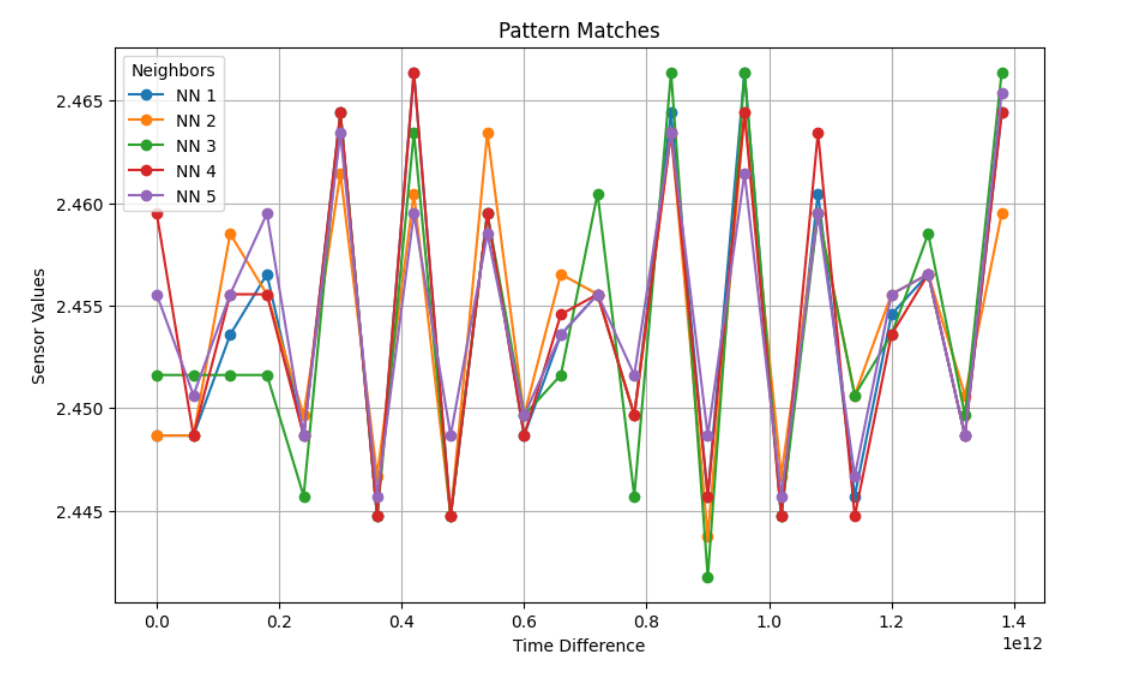
Search the vector database for the selected pattern to retrieve and visualize the five closest values.
5. Delete KDB.AI table
It is a best practice to delete KDB.AI tables when you are finished using the table.
Summary
In this post, I ran the pattern matching sample code of KDB.AI on Databricks. I think it's great that you can quickly create indexes, search data, and get results.
In the next post, I would like to test other KDB.AI sample codes on Databricks and introduce them as in this post.
Thank you for reading until the end. Thank you for your continued support!

We provide a wide range of support, from the introduction of data analysis platforms using Databricks to support for in-house production. If you are interested, please feel free to contact us.
We are also looking for people to work with us! We look forward to hearing from anyone interested in APC.
Translated by Johann