Introduction
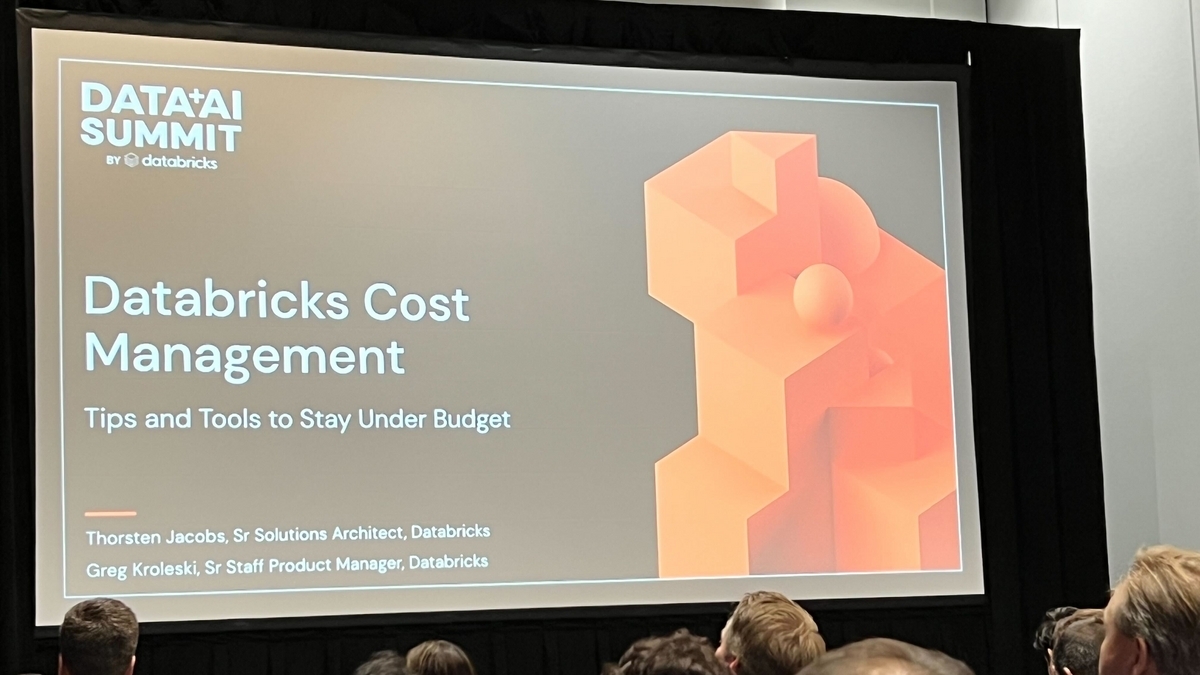
I'm Chen from Lakehouse Department, GLB Business Department. "Databricks Cost Management: Tips and Tools to Stay Under Budget" based on a report by Mr. Kanamaru who participated in the local Data + AI SUMMIT 2023 (DAIS) Here is an overview of the session.
This session was led by Thorsten Jacobs (Sr. Solutions Architect) and Greg Kroleski (Product Managments) from Databricks. An easy-to-understand summary of tips and tools to help you stay on budget with Databricks cost management.
Cost control tips to stay on budget
Cost control is an important factor when using Databricks. The following tips will help you stay on budget.
- Workload optimization: Workload optimization can improve resource utilization and reduce costs
- Right-sizing your cluster: Right-sizing your cluster can help you avoid wasting resources and keep costs down.
- Leverage autoscaling: Leverage Databricks autoscaling feature to automatically adjust cluster size based on resource usage to optimize costs
- Using Spot Instances: Using Spot Instances can significantly reduce costs
- Resource monitoring and analysis: Monitoring and analyzing Databricks resources enables cost visualization and appropriate cost management.
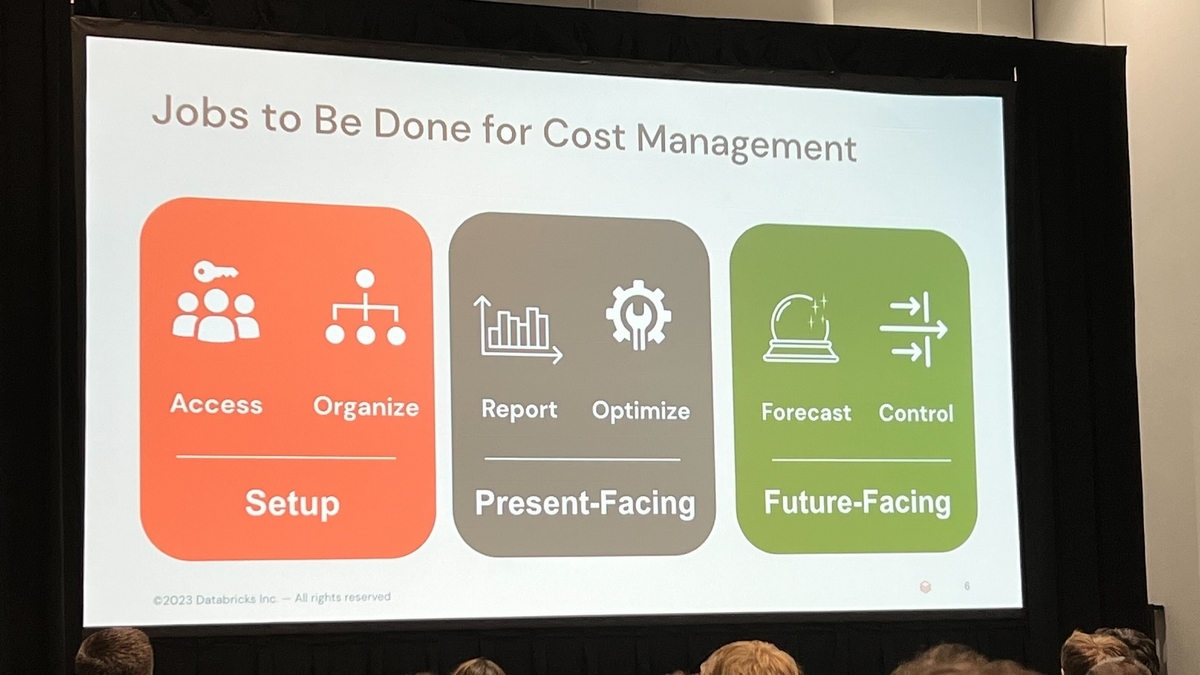
Understanding clusters and cost management is key
In Databricks cost management, the first thing to understand is the relationship between clusters and cost management. A cluster is a collection of computing resources used for data processing and is a major part of Databricks' costs. Therefore, proper management of clusters leads to cost savings.
Breakdown of GPU cost and cost analysis method using system table
Of the Databricks costs, GPU costs tend to be particularly high. By understanding the breakdown of GPU costs and using system tables for cost analysis, you can reduce unnecessary costs. The following information can be obtained by using system tables.
- Cluster usage
- Cluster start/stop history
- Cluster costs
With this information, you can optimize cluster usage and reduce costs.
How to create cost charts and understand trends and usage using SQL queries
Databricks allows you to create cost charts using SQL queries. By creating a cost chart, you can visually grasp the following information.
- Cost trends
- Cluster usage
- Resource consumption
Based on this information, you can take measures to reduce costs. For example, you can reduce costs by stopping your cluster during times of low cluster usage.
Summary
Watched a talk on Databricks cost management that provided tips and tools to stay on budget. How important it is to understand clusters and cost management, how to analyze costs using GPU cost breakdowns and system tables, how to create cost charts using SQL queries to understand trends and usage, etc. I was able to learn a lot of information. With this information, you can effectively manage your Databricks costs and stay within budget.
Conclusion
This content based on reports from members on site participating in DAIS sessions. During the DAIS period, articles related to the sessions will be posted on the special site below, so please take a look.
Translated by Johann
Thank you for your continued support!