Introduction
This is Abe from the Lakehouse Department of the GLB Division. I wrote an article summarizing the content of the session based on reports from Mr. Ichimura participating in Data + AI SUMMIT2023 (DAIS).
Articles about the session at DAIS are summarized on the special site below. I would appreciate it if you could see this too.
Graph Data and Analytics Journey Begins at Lakehouses
This time, I will talk about the talk "Lakehouses: The Best Start to Your Graph Data and Analytics Journey". The speaker is Douglas Moore of Databricks, Lead Specialist Solutions Architect. This talk covered the challenges of graph databases and their potential machine and deep learning support, with Lakehouses being the best start to your graph data and analytics journey. It is of great interest to data scientists, data architects, data engineers, and anyone interested in data analysis.
Let's take a look at the contents of the lecture!
Data Scientist Quinn's Challenge: Complex Datasets and Graph Analysis
One day, data scientist Quinn received a complex data set from her boss and decided to work on graph analysis. It was a new approach to dealing with complex data structures that traditional relational databases couldn't handle.

Graph database challenges
However, graph databases have had some challenges.
Scalability: Distributed and parallel processing is required to handle large datasets, which is not easy.
Performance: Queries run slowly and are not suitable for real-time analysis.
Flexibility: Data integration is difficult due to the difficulty of accommodating different data sources and data formats.
Support for machine learning and deep learning
Additionally, graph databases had poor support for machine learning and deep learning. In order to utilize these technologies, the following functions are required.
Easy data preprocessing and feature extraction
Ability to combine and execute multiple algorithms and models
Easy management and deployment of trained models
Lakehouses: The Best Start on Your Graph Data and Analytics Journey
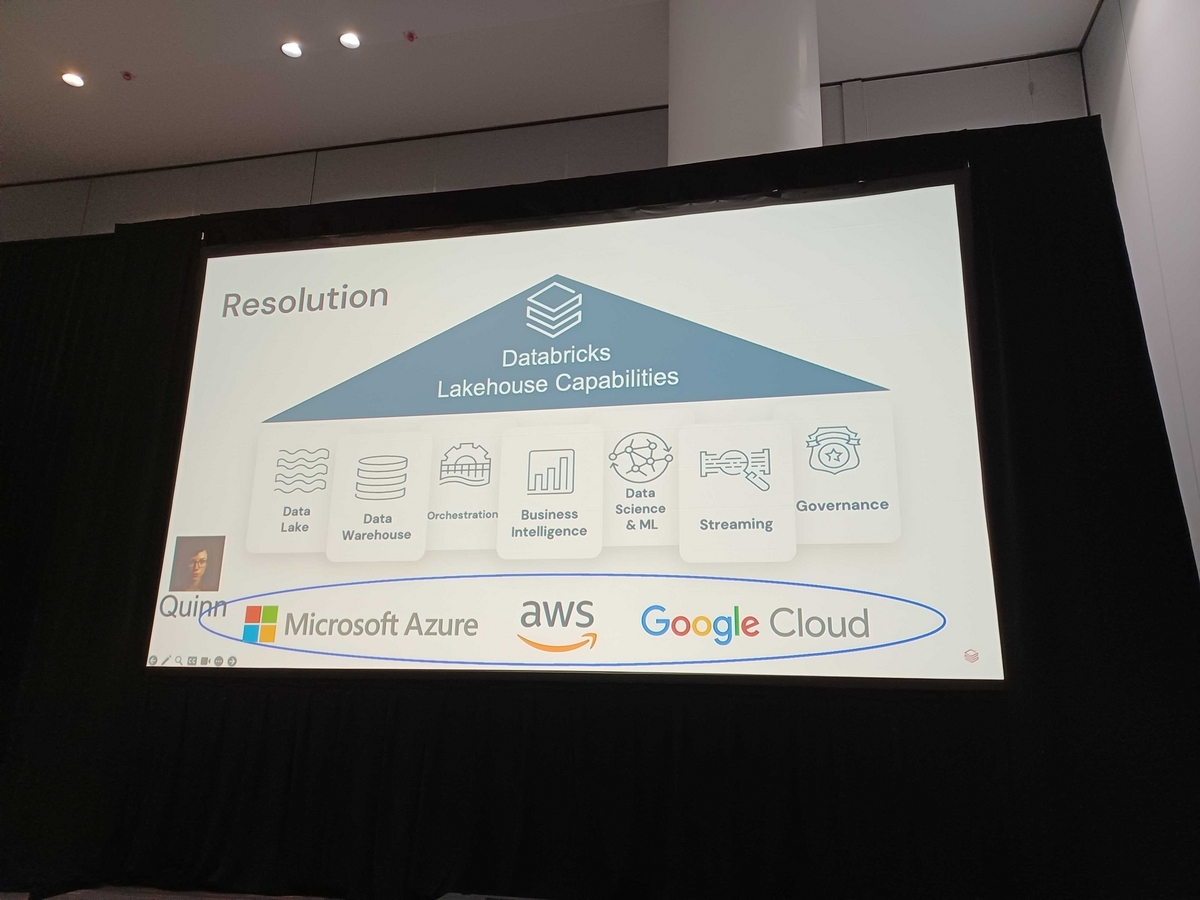
That's where Lakehouse comes in. It is a new data management architecture that combines the capabilities of data lakes and data warehouses, solves the challenges of graph databases, and also provides support for machine learning and deep learning. Below are the features of Lakehouse.
Scalability: Distributed and parallel processing allows for large datasets.
Performance: Fast query execution and real-time analytics.
Flexibility: Supports different data sources and data formats, and facilitates data integration.
Machine Learning and Deep Learning Support: Easy data preprocessing, feature extraction, model management and deployment.

Latest concepts and features
Lakehouses incorporates the latest concepts and features.
Data versioning: You can manage the history of data changes and revert to past states.
Schema Evolution: Automatically adapts to changes in the schema of your data.
Security: Easily control and audit access to data.
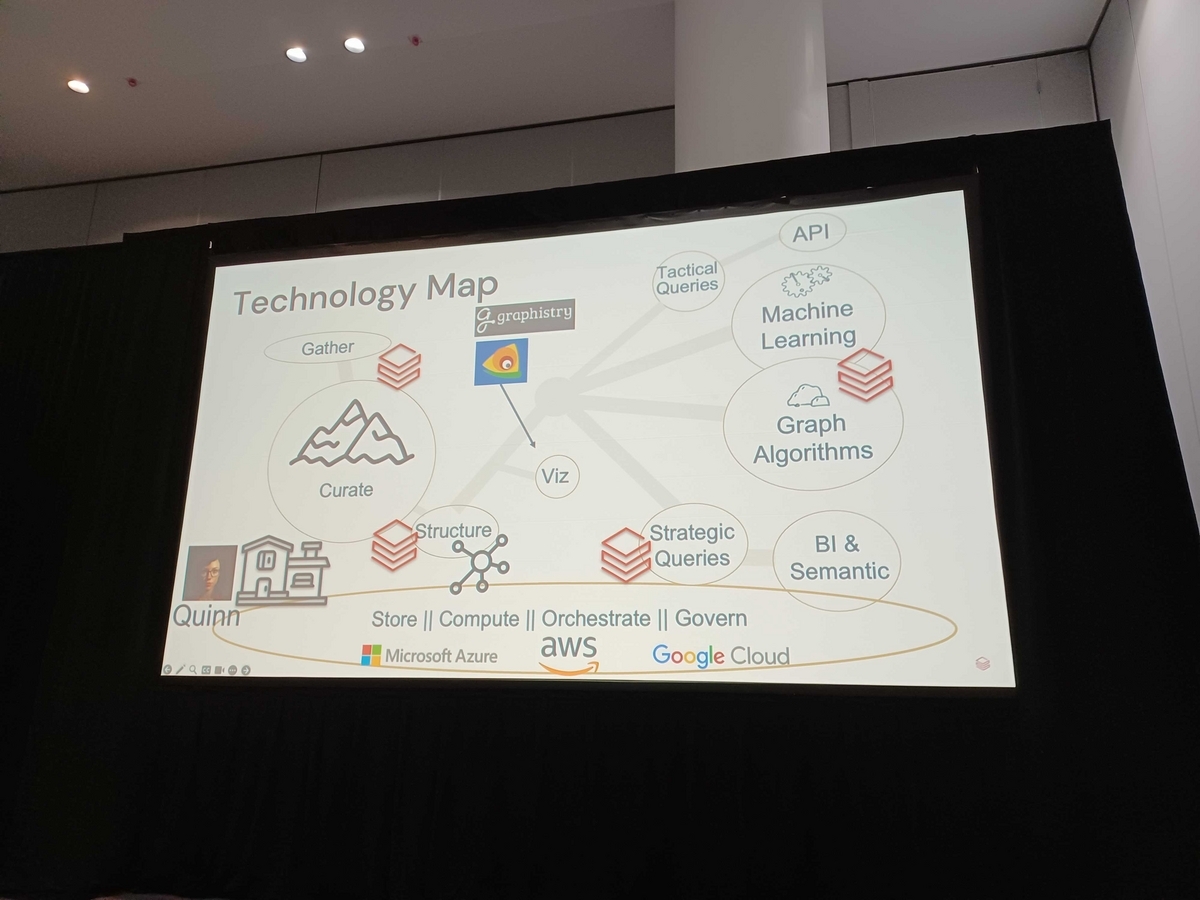
These features gave Quinn a smooth start to her graph data and analytics journey. Lakehouses is the best choice for solving the challenges faced by data scientists and engineers and unlocking the full value of their data.

Supply chain visualization and risk reduction using graph neural networks
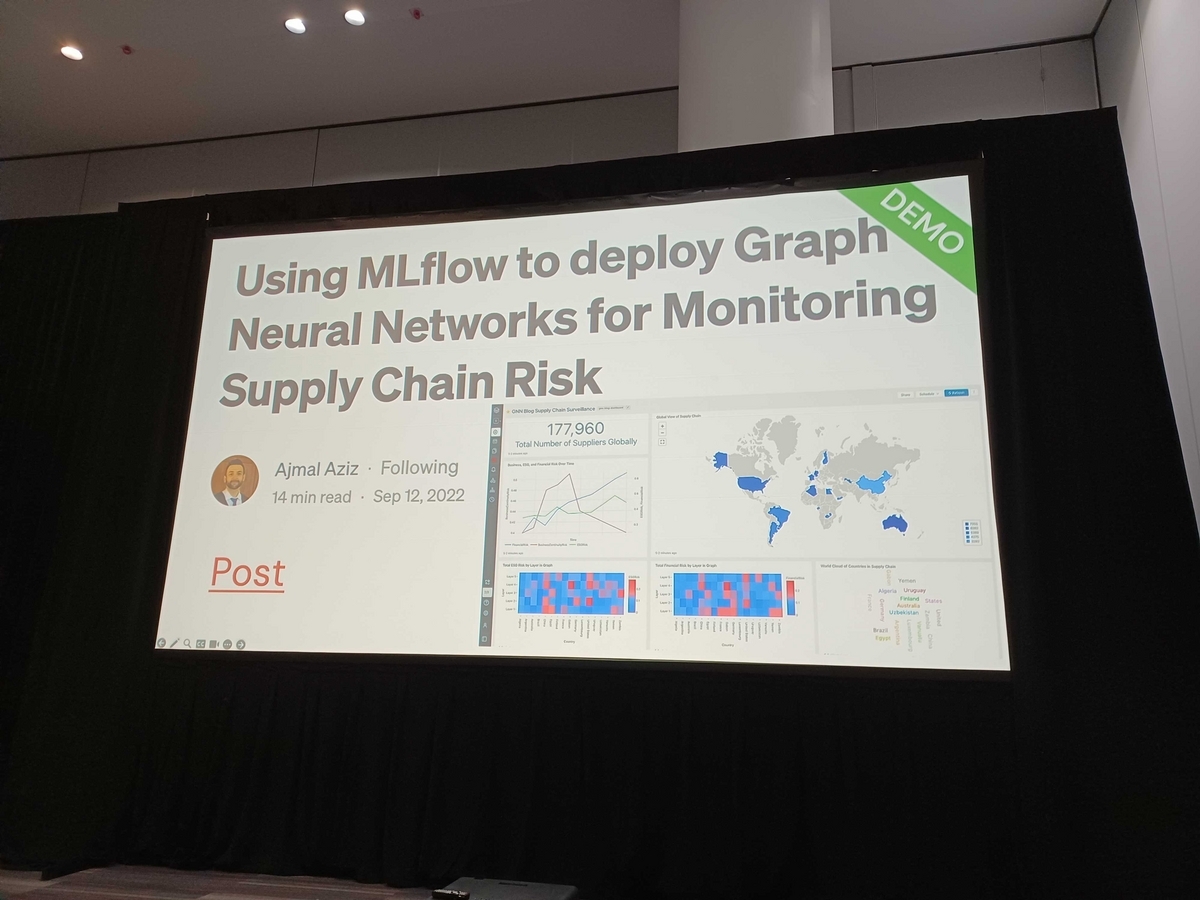
In this presentation, a project to visualize a company's global supply chain using graph neural networks and reduce risk was introduced. Graph Neural Networks also discusses the challenges of graph databases and their potential machine and deep learning support.
What is a graph neural network
A graph neural network (GNN) is a neural network for working with graph data. Graph data is a data structure consisting of nodes (vertices) and edges (sides), and is used in various fields. Since GNN can capture the characteristics of graph data, it provides effective solutions to problems that were difficult with conventional neural networks.
Supply chain visibility and risk mitigation
By utilizing graph neural networks, it is possible to visualize a company's global supply chain. This allows you to assess risks across your supply chain and develop risk mitigation strategies. Specifically, the following uses are conceivable.
Supplier risk assessment: Relationships between suppliers can be represented as graph data and risk scores can be calculated using GNN.
Supply chain optimization: GNN can be used to optimize the cost and lead time of the entire supply chain.
Simulation of risk mitigation measures: Using GNN, you can simulate the effects of risk mitigation measures and select the optimal measures.

In this way, it was found that the use of graph neural networks can realize visualization and risk reduction of supply chains.
Summary
In this talk, the challenges of graph databases and their potential support for machine learning and deep learning were discussed, and Lakehouses was proposed as a solution. In addition, examples of supply chain visualization and risk reduction using graph neural networks were introduced. For data scientists, data architects, and data engineers, the use of Lakehouses and GNN will become more and more important in the future. Please take this opportunity to learn about Lakehouses and GNN!
